Talk preseted at Eurographics UK Chapter at 28 March 1996.
Visualization of Molecular Dynamics Simulations V.L.Bulatov(*), R.W.Grimes
Department of Materials, Imperial College
(*) on leave from the Institute of Physics, St.Petersburg University
This paper discusses several computer graphics approaches used to visualize the evolution of nanoclusters. The systems being considered are clusters of between several hundreds to several thousands of ions. These are subject to Newton's laws of motion and forces are described through pair-wise interactions. Clusters are studied at different temperatures, from 10 Kelvin to several thousands of Kelvin; from the crystal phase to evaporation.
Different graphical methods are used to stress different aspects of cluster behaviour over different time scales. High quality animation using a ray tracing technique was produced for detailed visualization of the evolution of the clusters at 'slow' time scales (0.5 picosecond of cluster life per second of movie).This was crucial in discovering the quasi molecular behaviour of this purely ionic system at high temperatures. A direct volume rendering technique and isosurface extraction was used to produce the animation of the density distribution at 'fast' time scales (2 picoseconds per second). This approach revealed the hydrodynamics oscillations of the simulated cluster in liquid phase. A movie of the rough replacement of the detailed shape of the cluster by ellipsoid of inertia was used to stress the evolution of cluster's shape.
Low resolution movies in MPEG format are available online Video is available on request.
1. Introduction
The drive to produce microelectronic devices has recently been joined by the desire for micromechanical devices. The same scale of materials engineering is also required by the chemical industry, particularly for microporous and mesoporus catalysis. This is leading to the point where experimental techniques must be supported directly by computer simulations. In drug design this has been the case for some time but with crystalline solids the field is less mature though not new. Part of the reason for this is that, if dynamical effects are to be addressed, many problems require a very great number of ions or atoms to be modelled explicitly. The modelling methodologies necessary to undertake such studies are well developed and the computational resources are begining to be commensurate with the task. However, the visualization of large numbers of mobile ions deserves greater attention. This is the problem which will be addressed here.
2. Statement of the problem
The systems being considered are nano-clusters varying in size from several hundreds to several thousands of ions. The forces which act between the ions of the clusters are described by pair-wise interactions: long range Coulombic potentials balanced by short-range parameterized interactions[Dornford-Smith, Grimes]. The movement of the atoms is dictated by Newton's equations of motion:
where mi is the mass of ion i, ri is its position and Vij(ri,rj) the interaction potential between ions i and j.
The equations of motion are solved using Gear's 5th order predictor corrector algorithm within the molecular dynamics code Penicillin [Dornford-Smith, Grimes]. Adjustable time steps were used to guarantee energy conservation. Cluster temperatures were raised from 10 Kelvin upto several thousands of Kelvin. Initially the clusters were nano-crystalline. A typical time for the numerical experiment was 100 picoseconds of physical time, which translates to about 100 hours on a modern workstation.
For a cluster of 1000 atoms, the numerical procedure invloves approximately 100,000 time steps and produces 3*1000*100,000 = 3*108 floating point numbers of trajectories of the particles. In theory this requires approximately 2 Gb of external storage which is clearly difficult to handle. Therefore trajectories was stored only at each 50th time step and smooth interpolation procedures were used laterly to obtain trajectories at moments of time between the grid points. Such an approach reduces the size of each data set to a reasonable 50 Mb.
3. Visualization of the results
At first sight the problem seems trivial: what can be easier than drawing coloured balls. However, if the number of balls is several thousand, one requires an extremely fast 3D graphics board to observe the smooth motion. Indeed, we found that the SGI Indigo2 with Extreme graphics was unable to carry out real time visualization of this problem. Movement will be sensed as continuous only if it is played at least at the speed of video and cinema standards - 25 frames per second. Even then there are problems of temporal aliasing - creating visual artefacts - if the movement of objects in the scene is too fast.
To solve the real time playback problem, the MPEG movie production was chosen as an appropriate alternative to a graphics workstation.
Why the MPEG format?
- MPEG has a very efficient compressing algorithm (typical ratio of compressed to uncompressed picture size 1:30). The typical uncompressed image size of a movie we produced to date was 2 GB. This was reduced to an acceptable 70 MB of MPEG movie.
- MPEG has a well documented format and public domain encoders on all computing platforms.
- MPEG is supported by many afordable hardware decoders on PC and other platforms and by software decoders with reasonable speed.
- MPEG's standard resolutions (352x288 - PAL, 352x240 - NTSC) correspond to the resolution of standard video recorders.
Visualizing a set of trajectories from clusters which consist of many particles is not the only challenge. The evolution of the cluster is a complex combination of individual and collective motions. These have different time scales which should be visualized at their appriopriate speeds. Various approaches to this problem are discussed in the next sections.
3.1 'Slow' time scale visualization
If we wish to see a detailed and smooth movement for each particle in the simulation we should carefully choose the time interval between individual frames. Too short or to long an interval will destroy the impression of smooth motion. We found experimentally, that the best time between frames is 0.02 picosecond and this allows us to obtain a smooth motion at all the temperatures at which clusters were studied (from 10K to 5000K).
There are several ways to allow the human visual system to form an impression of the 3D structure of a complicated object projected on a 2D screen. For example, one rotation of the object, rendered with average graphics quality. This is available on high-end graphics workstations in an interactive regime. Alternatively, it is possible to make a high quality photorealistic raytraced still image to help the human visual system to capture a 3D impression. This second approach is now available on a PC with at least a 32 bit processor. Several programs for raytracing are available on the Internet, the most popular of which is "Persistence of Vision Ray Tracer" (POV-Ray), available from http://www.povray.org. This was employed here; it has a simple but powerful input language.
Using raytracing in scientific graphics is now becoming more popular. There exist several programs, which produce output in the POV-Ray language: in particular, converters from Mathematica and MappleV file formats, and the molecular visualization program vmd. Images of the quality produced by the raytracing technique are, however, unavailable in an interactive mode.
When the object has its own evolution, as in molecular dynamics simulations, the first approach becomes redundant because it is difficult to see the evolution of something which is itself moving. Therefore the only rational approach is to use high quality image production based on the raytracing technique. Figure 1 shows several frames from the video of the evolution of an LaF3 nanocluster. These frames show the cluster at different temperatures and in different aggregate states: solid, liquid and essentially gasious.
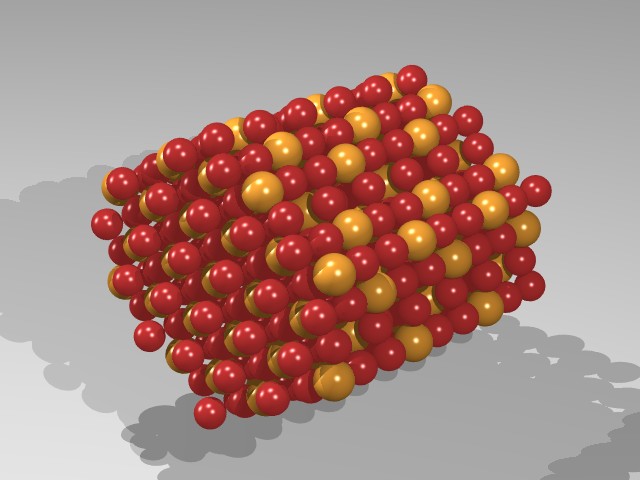
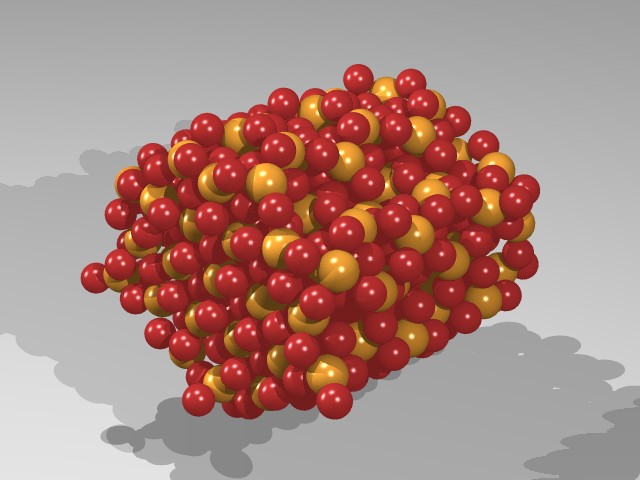
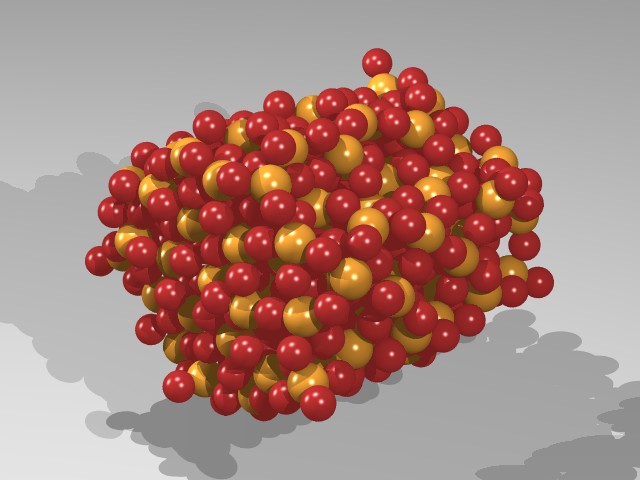
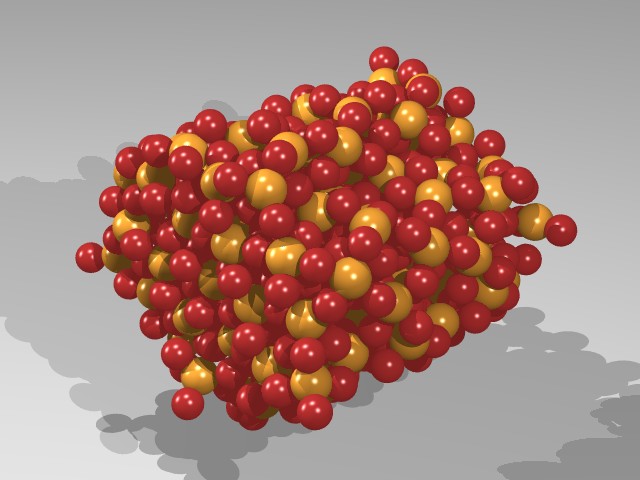
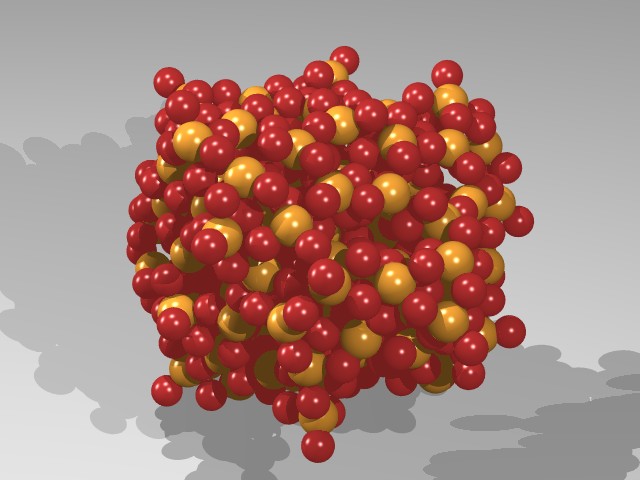
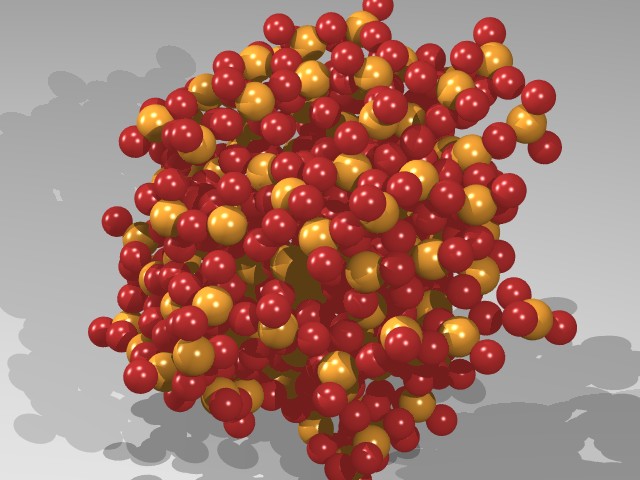
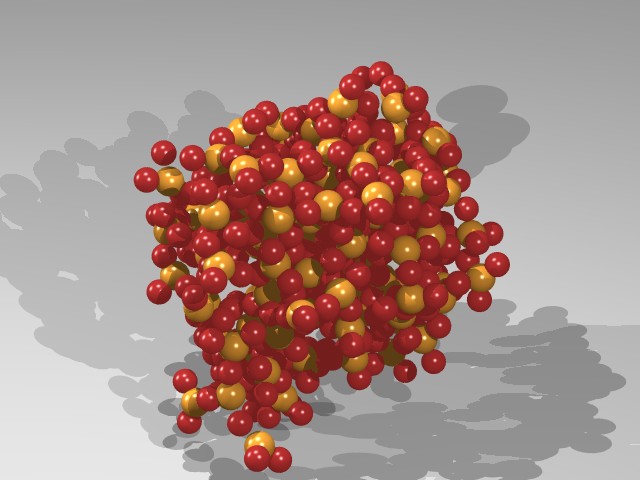
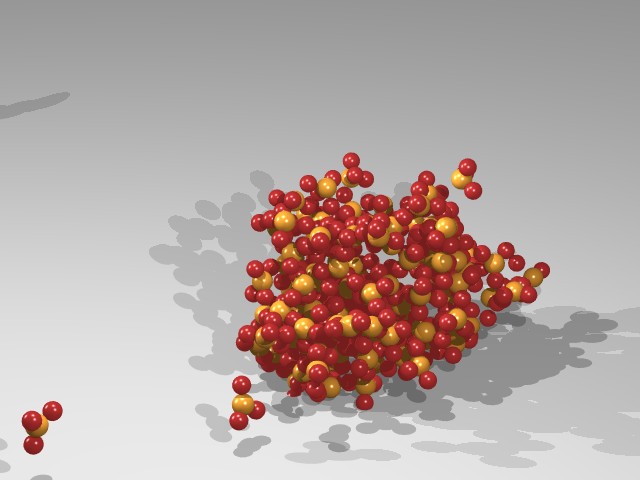
Video sequences allows us to see very clearly the relaxation of the two hexagonal basal faces of the nano-cluster and large, complex reconstruction of the six prismatic side faces. Nevertheless, the still images give too little information about the relaxation process.
The most remarkable behaviour to be obtained from the observation of the video sequences is the "quasi molecular" behaviour of the LaF3 cluster in the liquid phase. It was seen that during the gradual migration of an La ion through the cluster, a number of adjacent fluorine ions tended to move with the La ion. This is surprising for we treated LaF3 as a purely ionic material, that is no directional bond forces were included.
How can this observation be visualized using still images? Our solution is shown in Figure 2. First, it must be realised that two different types of displacement appear on the same graph. First the displacement of a single La ion (shown by the open circles). Second the displacements of a number of F ions but relative to the La ion (shown by the dots). The graph is constructed in the following way. At some time, t, an arbitrary La ion is chosen and a number of nearest neighbours F are identified. The open circles show the displacement of the selected La ion from its position for several picosecond before and after the time t. The dots on the graph therefore show the distances of the selected F ions from the displaced La ion (i.e. from the updated position of the La ion). The criteria of "movement together" is then demonstrated by the presence of dots on the graph below circles, that is, the distances between the La ion and some F ions have changed less than the distance which the La ion has itself travelled.
3.2 'Fast' time scale visualization
This approach is designed to capture quite different aspects of cluster behaviour. It was developed after unsuccessful attempts to watch the movement of clusters at high speeds. The problem becomes apparent when the speed of the cluster's evolution movie is played back 5 times faster by dropping each 4 frames out of every 5. At such speeds it is impossible to understand what is happening because ions move so far between frames that the human eye is unable to interpolate continuous movement between frames. Thus we require something which will fill the space between ion positions caught by sequential frames.
The following model was used. Let us assume that each ion creates around itself, during its motion, some continuous matter distribution i.e. density and that this is maintained when it moves. Let us also assume that each portion of the matter has a finite life time and that this disappears after some fixed time (or decays exponentially). We can consider the whole distribution, created by all ions as some temporal average of our cluster with an average time equal to a fixed chosen lifetime. It must be realised that this is not the same as the distribution which would be created by ions located at average positions.
After creating such a two component distribution of matter, with one component for each type of ion, we now have the classical problem of the visualisation of volumetric data (see for example [Watt, Watt]).
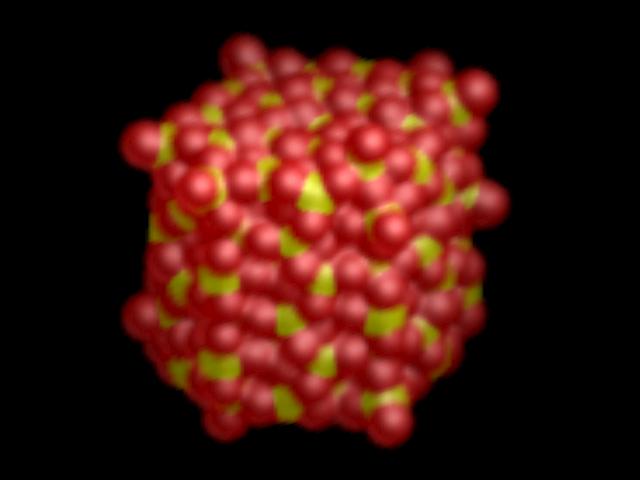
Two common techniques were used. The results of one approach, from the rendering of a selected isosurface of the distribution from each type of ion, is shown in Figure 3. Isosurface representations of volumetric data have well known weaknesses amongst which is the possibility of loosing some of the fine details of the distribution. However, this is not critical in our case. Modified versions of the scientific visualisation library [Bulatov] were used to render isosurfaces.
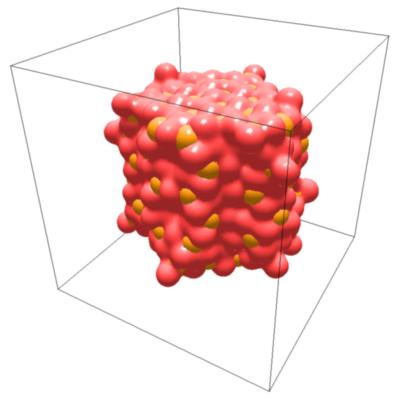
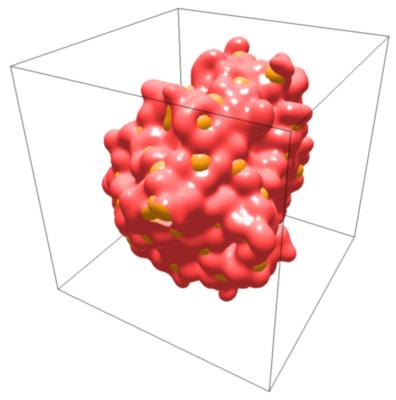
An alternative approach is direct volume rendering. Here the VolPack [Lacroute] program was used for volume rendering. The direct volume rendering algorithm constructs an image using all the available data, shooting rays though the data distribution and calculating the resulting intensity using a chosen model of emission, absorption and reflection of light. Each distribution component had been assigned a different modelling material with a different colour. Both volume visualization techniques gave approximately the same visual effect.
This "fast movie" visulalization approach removes all high frequency oscillations from the images and allows us to see long time scale behaviour. In particular we are interested in global oscillations in the solid phase and the fast changing of shape from roughly prismatic to roughly spherical during the melting process at 1700 Kelvin.
3.3 Shape visualization
It is often desirable to have a detailed graphical representation of the whole system, but sometimes we require less. Detailed images divert attention and may sometimes hide certain aspects of a system's behaviour. In particular it is interesting to see how the shape of a cluster changes during the heating process. Two approaches were used to study shape visualization: calculation and rendering of the inertia tensor and of the alpha shape calculation.
Moments of inertia are eigenvalues of the inertia tensor of the system. The inertia tensor Iik of system of particles is a 3x3 matrix which is defined as follows [Landau]:
where mj is the mass of particle j, xi the cartesians coordinates of particle j and rj the distance of particle j from origin. The inertia tensor in the definition above depends on the location of the origin. We choose the centre of gravity as the fixed origin.
The inertia tensor is a symmetrical tensor (Iik = Iki), therefore it has only 6 independent values. Several techniques may be used for the visualization of a symmetric tensor. A symmetric tensor always has a complete set of orthogonal eigenvectors and real eigenvalues. Therefore the simplest technique to show the time evolution of an inertia tensor is to draw a 2D graph of its eigenvalues as a function of time
This graph in Figure 4 clearly shows how the behaviour of the cluster changes from quite regular oscillations in solid phase, with periods of ~1 picosecond, to chaotic oscillations with much bigger amplitudes in the liquid phase with a typical time scale of about 10 picoseconds.
This approach shows only 3 of the 6 independent components of the inertia tensor. It also has three eigenvectors, which define its orientation. Visualization of the eigenvectors themselves does not make sense since they may change very rapidly when eigenvalues and shape change smoothly (for example at critical points when two or more eigenvectors are approximately equal).
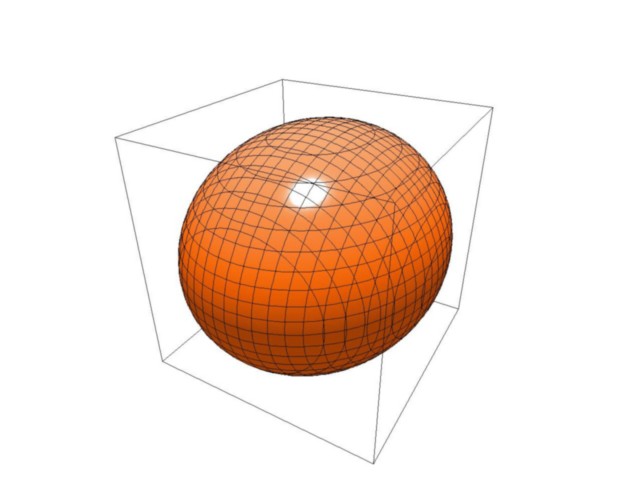
An alternative approach for the visualization of this tensor, which does not loose any information, is to represent this symmetrical tensor as an ellipsoid. The ellipsoid has the three eigenvectors of the inertia tensor as the direction of principal axis and eigenvalues as the lengths of the principal axes.
The simplest way to draw such an ellipsoid is to make a unit sphere and transform each its points using the inertia tensor as the transformation matrix. The time evolution of such an ellipse is difficult to draw as a still image because the ellipses in the adjoining moments of time will overlap in space. We need to use the 4th coordinate as the t-axis; the natural choice of 4th axis is time. Figure 5 shows several steps from an MPEG movie, which was made to see the inertia tensor of the cluster in motion.
Results from the "fast" visualization and the visualization of the moments of inertia have encouraged us to make continuum calculations to model the behaviour of the cluster [Bulatov, Grimes, Harker]. These calculations show good agreement with the behaviour of nanocluster, a surprising result for clusters consisting of only 500 (and even 160) ions.
3.3.1 Alpha shape
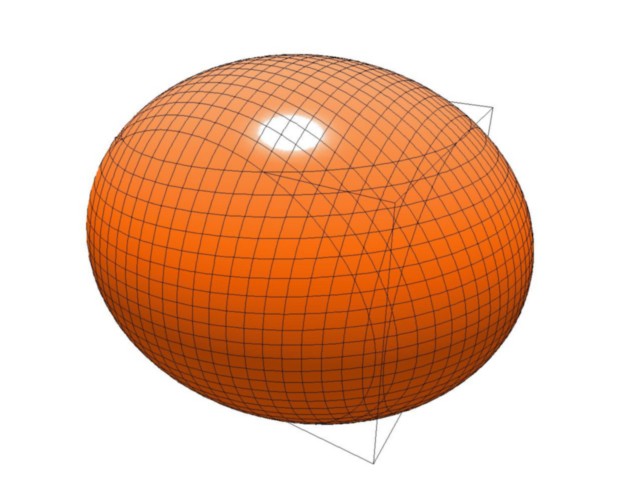
The inertia tensor gives a very rough approximation to the shape of a set of points. Its image, as an ellipse, is always convex and will blow-up when evaporation occurs. The alternative approach [Edelsbrummer] to the visualization of the shape of an irregular set of points, is to build the so called alpha-shape of the set.
The alpha-shape was designed as a generalisation of a convex hull of a set and is based on Delaunau triangulation. Roughly speaking the idea is to build a set of 3d tetrahedrons with atoms as vertices. The tetrahedron set should be as good as possible (thereby avoiding tetrahedrons with too small angles). The next step is to remove all tetrahedrons which are larger than some fixed radius (erase with thick 3D eraser). The remanent is called the alpha shape with alpha equal to the radius of the eraser. When alpha changes, it generates a whole discrete family of shapes capturing the intuitive notion of a "crude" versus a "fine" set of points.
There are two publicly available tools for alpha shape generation. One program Alpha runs only on an SGI with good interactive possibilities but is not suitable for batch processing. The alternative program - hull based on algorithm from [Clarkson] is written in ANSI C and was used here to generate the triangle mesh, which was converted to POV-Ray format. Figure 6 shows the alpha-shape of the cluster at different stages of its evolution.
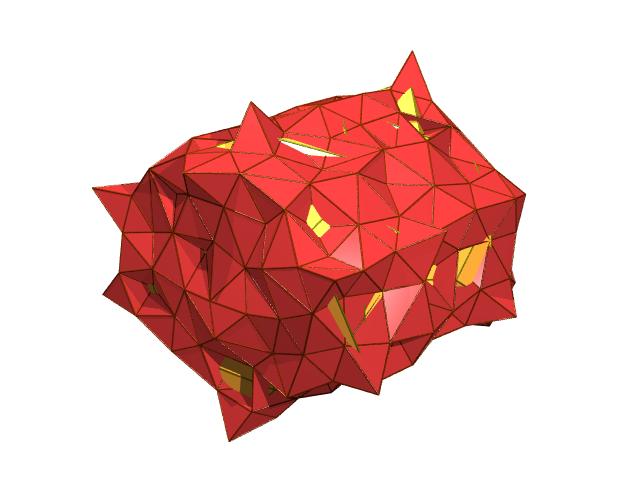
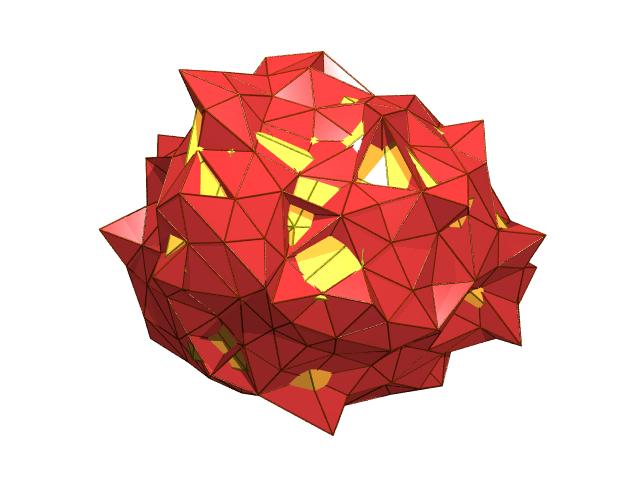
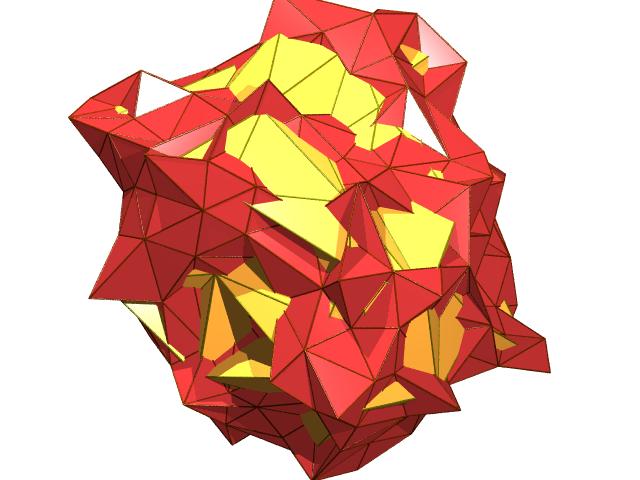
This approach is well suited to common shape analysis but has, in our opinion, the serious drawback of producing too angular a surface, which does not correspond to the physical properties of the system. Some smoothing of the surface should be attempted.
4. Conclusions
Visualizing the dynamical evolution of a nano-clusters requires us to consider both 'slow time scale' and 'fast time scale' phenomena. We have found that this cannot be achieved through one process alone. At the slow time scale, movies based on ray traced images created using the POV-Ray program gave best results. The appropriate time interval between frames was choosen to achive smooth movements. The MPEG format was then used for move production due primarily to its excellent picture compression ratio. At faster time scales atoms move too far between frames and movement is no longer continuous. This problem is solved by associating a density with atoms which leads to results in the form of volumetric data. This is then displayed either by direct volume rendering or by the rendering of a selected isosurface of the distribution. Finally we considered ways in which the overall shape of the cluster might be represented. Two methods were considered; the inertia tensor represented as an ellipsoid and the alpha shape calculation. Both methods have their draw backs. The inertia tensor gives a very rough approximation to the shape of a set of points. However, although more detailed, the alpha shape is too angular.
References
K.L.Clarkson, K.Mehlhorn, and R.Seidel..-Four results on randomized incremental constructions. Comp. Geom.: Theory and Applications, p. 185--121, 1993.
L.D.Landau, E.M.Lifshitz, - Mechanics, Pergamon Press, 1969.
Bulatov V.L., Dmitriev V.Yu.- Vizualization in scientific researches on personal computers. - The Third International Conference on Computer Graphics and Visalization (GRAPHICON-93). St.Petersburg, p.107-117, 1993.
A.Donford-Smith, R.W.Grimes - Novel vaporization mechanisms for NaF and CaF2 nan0-crystallites in vacuo. - Phylosophical Magazine B, 1995, vol.72, No 6, p. 563-576.
V.L.Bulatov, A.H.Hacker, R.W.Grimes - Classical Oscillations of LaF3 nanoclusters" (manuscript in preparation).
P.Lacroute, M.Levoy - Fast Volume Rendering Using a Shear-Warp Factorization of the Viewing Transformation. in: Proc.SIGGRAPH '94, p.451-458.
A.Watt, M. Watt - Advanced Animation and Rendering Techniques, A.W. 1992.
H.Edelsbrummer and E.P.Muecke.- Three-dimentional alpha shapes, ACM Transactions on Graphics, 13(1):43-72, 1994.


 e-mail:V.Bulatov@ic.ac.uk